Nifty Price Action Investopedia
Nifty Price Action Trend Analysis - Nifty Order Flow Chart Analysis / Delta Bar Statistics 20-03-25
Dr.Amir
Nifty Price Action
Daily price action analysis, trends, and trade opportunities with visual examples and Trading insights.
( " Focus on Risk Not on Reward " )
Date : 20-03-2025
( " Trading is a probability game so Analyse your performance ( Hit rate , Trading Errors etc...) after a set of sample size is being over let say 20" )
DEFINE MARKET STRUCTURE ( NIFTY & DOW )
IDENTIFICATION OF MARKET TREND
MARKET SENTIMENT ANALYSIS BY USING DELTA BAR STATISTICS & TRENDING OI DATA
TRADE EXAMPLES
IDENTIFYING AREAS OF TRADE OPPORTUNITY
VISUALISING LIKELY FUTURE TREND
AGENDA
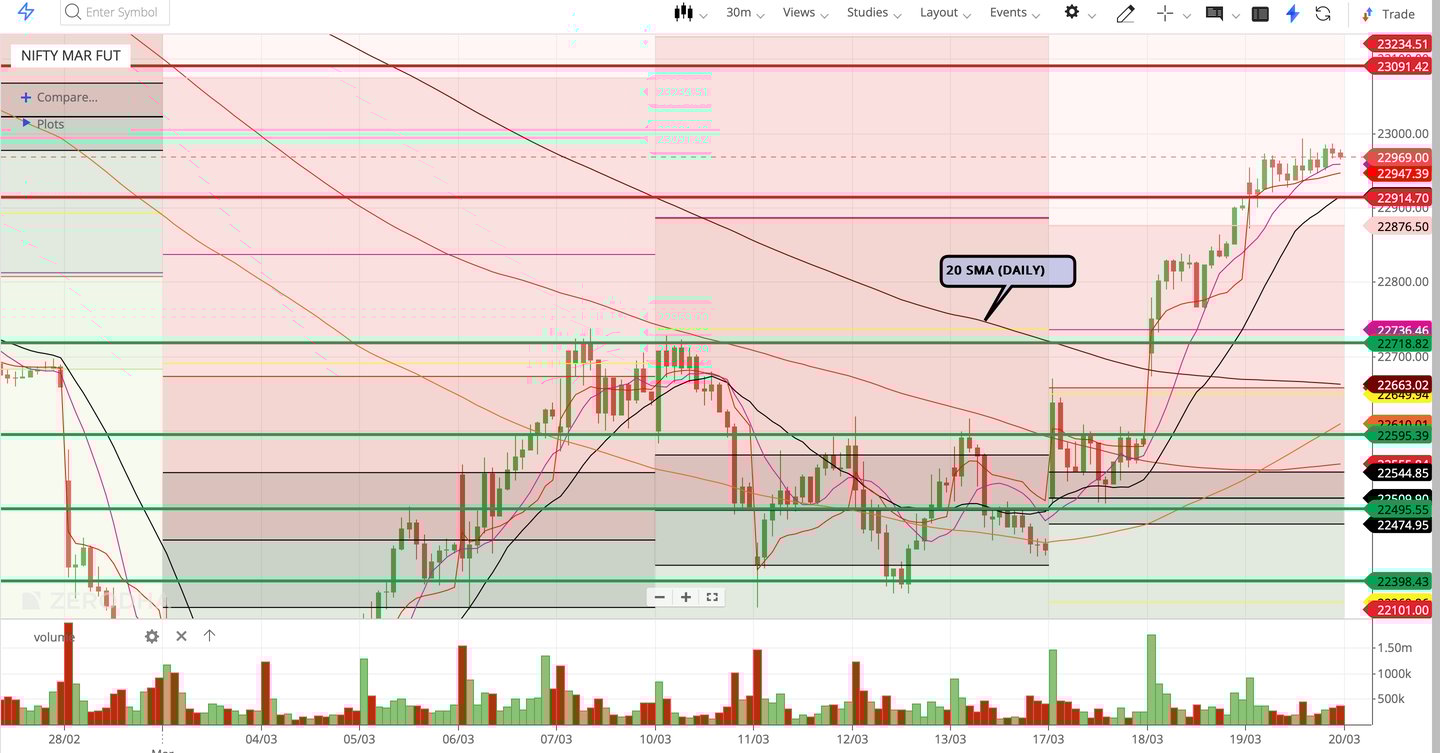
NIFTY MARKET STRUCTURE
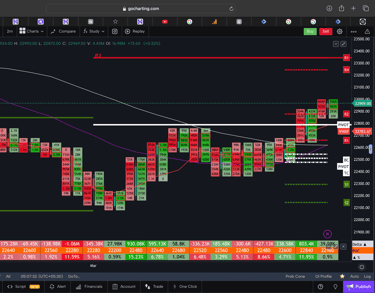
Nifty made breakout above previous day Range then taken pull back support from 22910 level and traded in SIDEWAYS just above that level by taking supports multiple times at VWAP Level.
Supports for Today Market --> 22910--22770--22720
Resistance for Today Market --> 23000--23100--23230
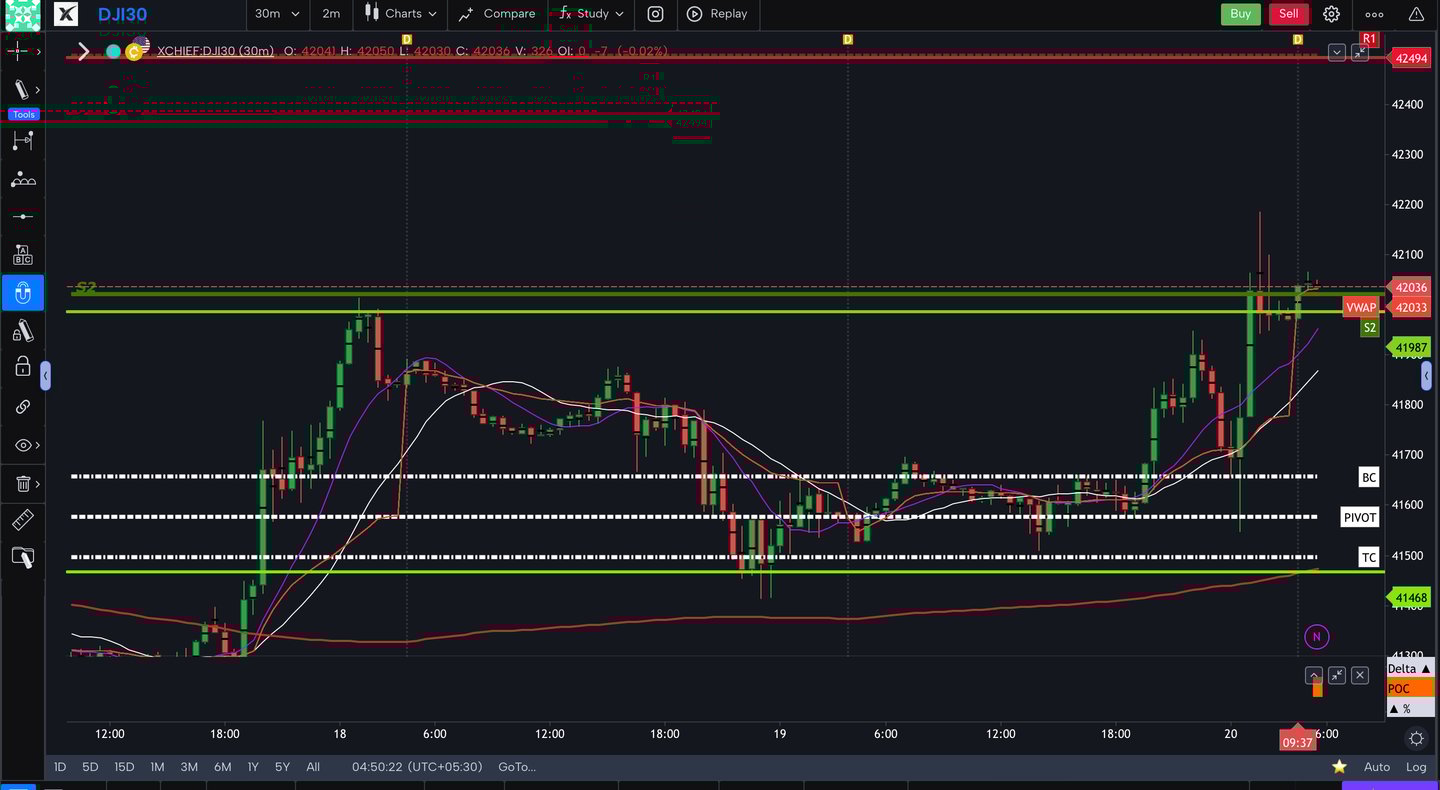
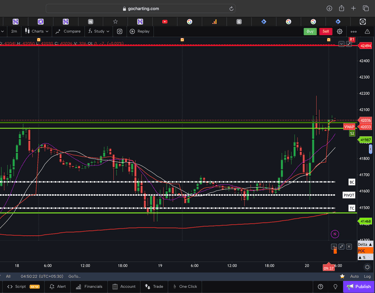
DOW JONES MARKET STRUCTURE
Dow jones got Supports from Weekly CPR Level ( 41500 - 41650 ) and With Bullish Momentum it made breakout above previous day High at 42000 Levels and got Minor pull back support from the same Level.
Dow Consolidated with Bullish Bias within Previous Day Range.
Supports for Today Market --> 42000--41600
Resistance for Today Market --> 42500--42850
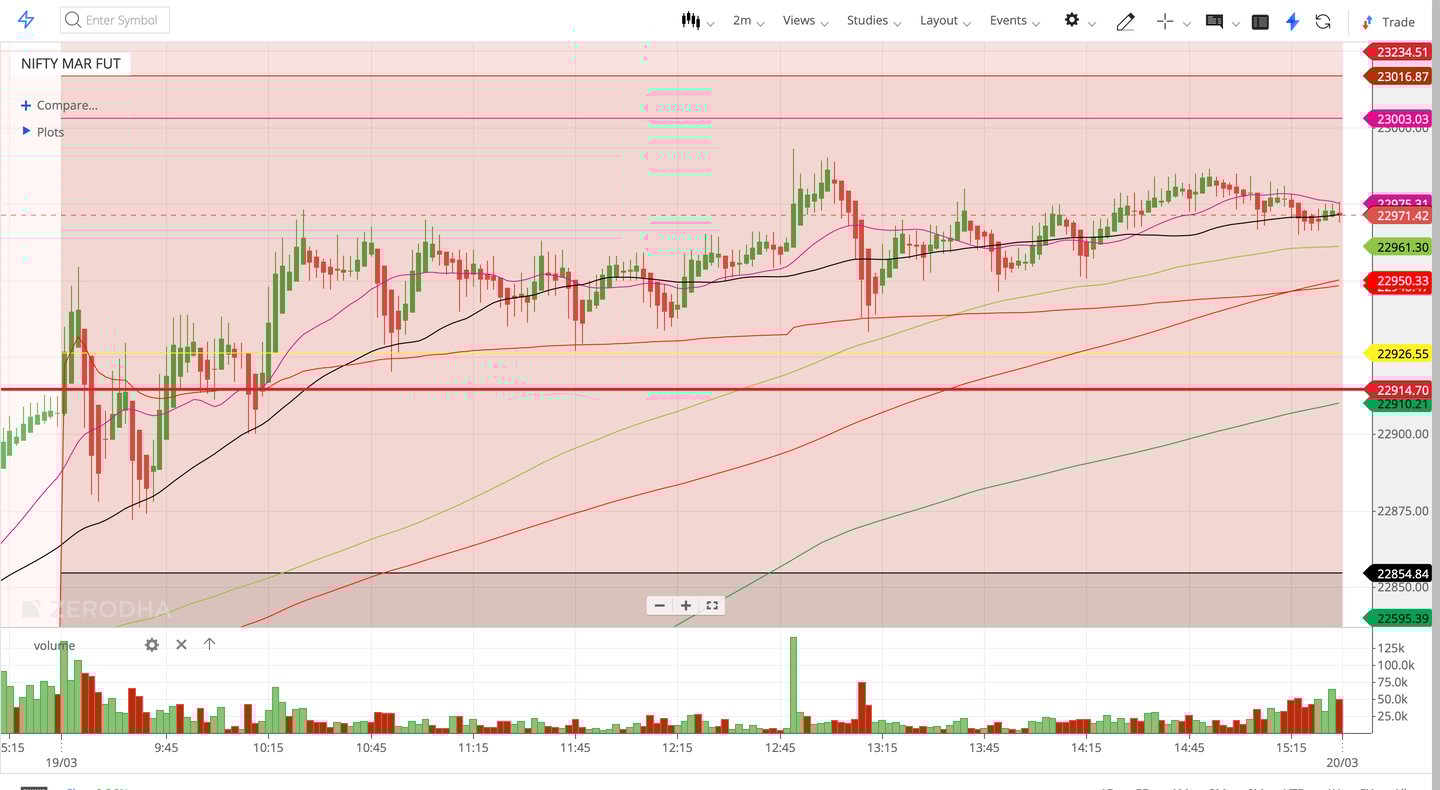
NIFTY MARKET TRENDS
Nifty made breakout above previous day Range then taken pull back support from 22910 level and traded in SIDEWAYS just above that level by taking supports multiple times at VWAP Level.
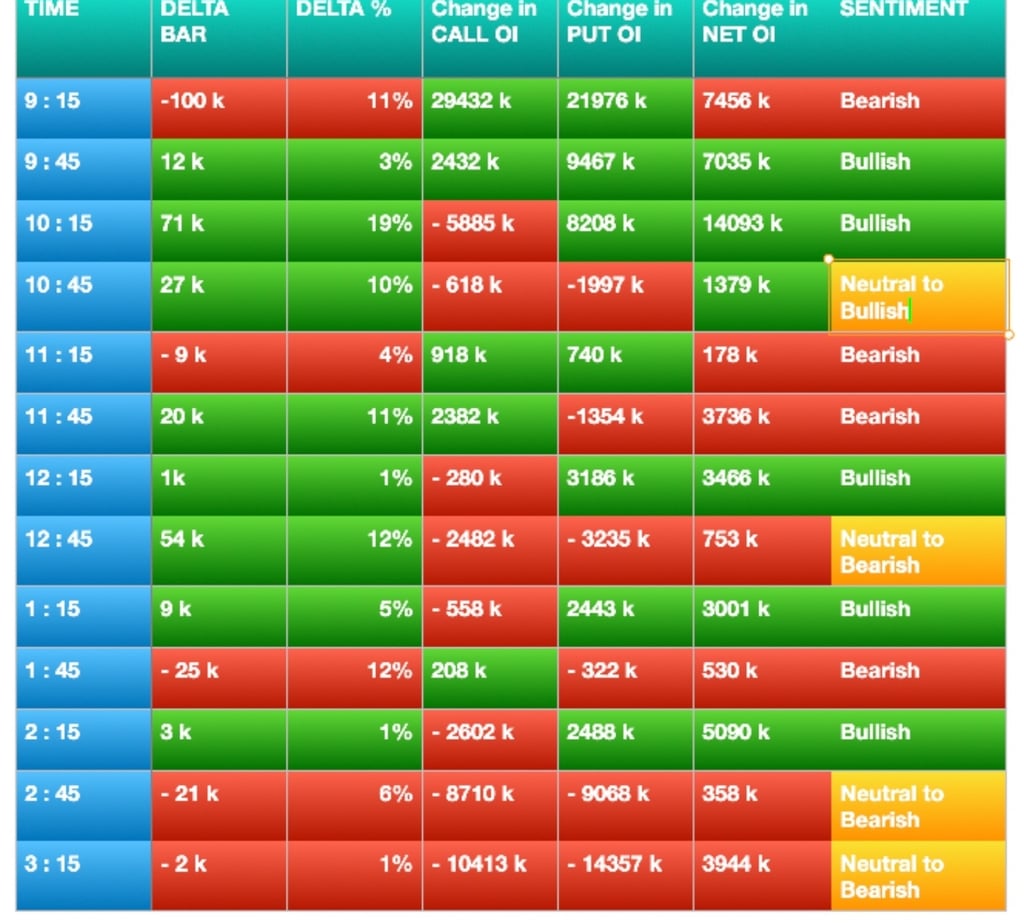

NIFTY MARKET SENTIMENT ANALYSIS BY USING DELTA BAR STATISTICS & TRENDING OI DATA ( 20-03-2025 )
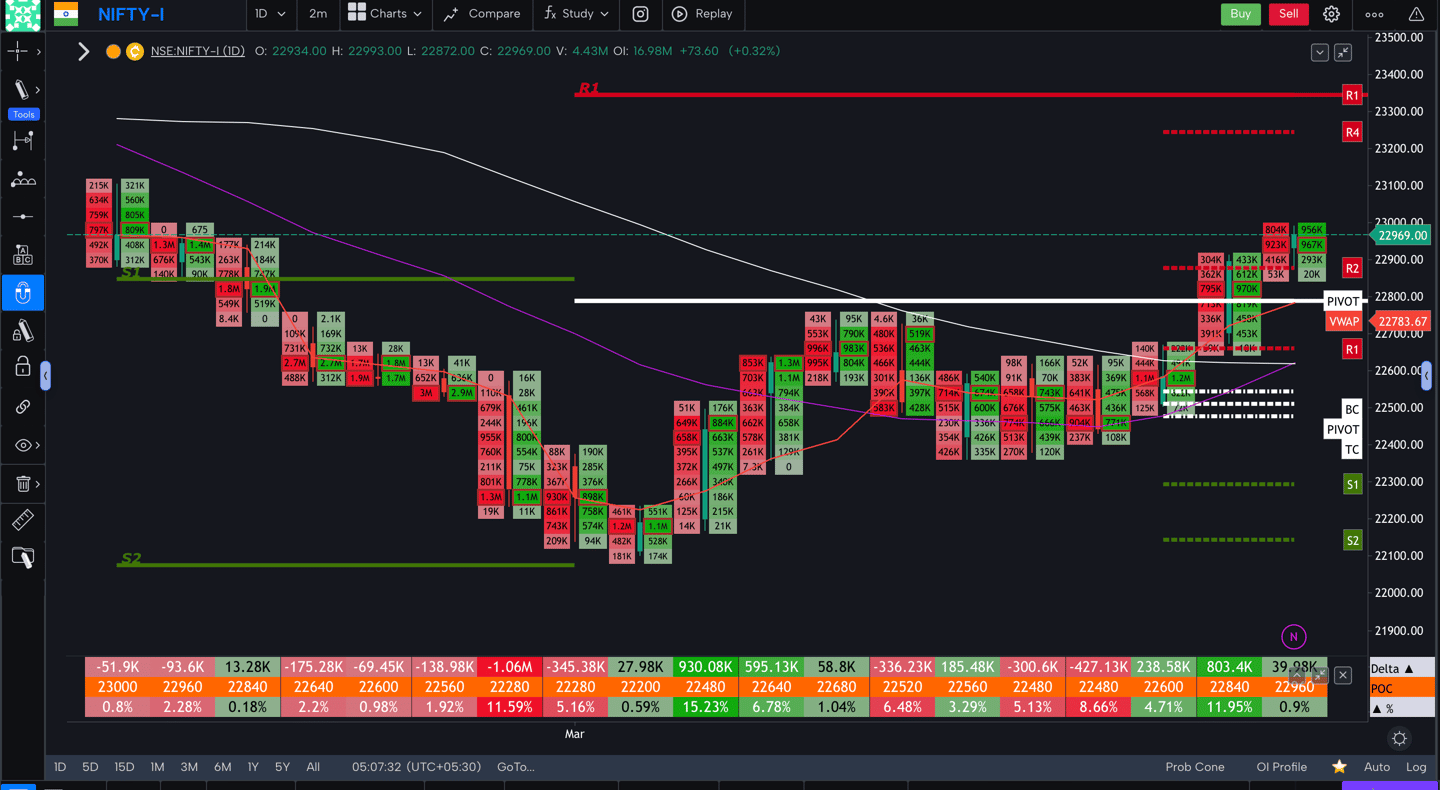
NIFTY MARKET FUTURE TRENDS PREDICTION
Nifty Daily candle looks like High close Narrow Range bullish Candle with bullish Bias and it tested and taken pull back support from 22910 Level in Daily Chart.
Scenario 2 - As our Mother Market Dow Jones shows Bullish Bias within Previous Day Trading Range we may have one more Day of Trading In a Range Day between 22910 Level on Down side to 23100 Levels on the Upside.
Scenario 1 - As the after noon session was in control of bulls they may break 23000 resistance today and trend towards 23100 and even beyond to test 23230 level.
Scenario 3 - Nifty may got Rejected from 23000 Level Then it may have Bearish Momentum to Break 22910 Level and then it may Head towards 22720 Level on Down side.
Daily analysis of Nifty price action trends.
Nifty price action - future trend prediction
© 2025 Nifty Price Action Invetopedia. All rights reserved.
Nifty price action investopedia
TO FOLLOW...
JOIN OUR SOCIAL MEDIA