Nifty Price Action Investopedia
Nifty Price Action Trend Analysis - Nifty Order Flow Chart Analysis / Delta Bar Statistics 19-03-2025
Dr.Amir
Nifty Price Action
Daily price action analysis, trends, and trade opportunities with visual examples and Trading insights.
( " Focus on Risk Not on Reward " )
Date : 19-03-2025
DEFINE MARKET STRUCTURE ( NIFTY & DOW )
IDENTIFICATION OF MARKET TREND
MARKET SENTIMENT ANALYSIS BY USING DELTA BAR STATISTICS & TRENDING OI DATA
TRADE EXAMPLES
IDENTIFYING AREAS OF TRADE OPPORTUNITY
VISUALISING LIKELY FUTURE TREND
AGENDA
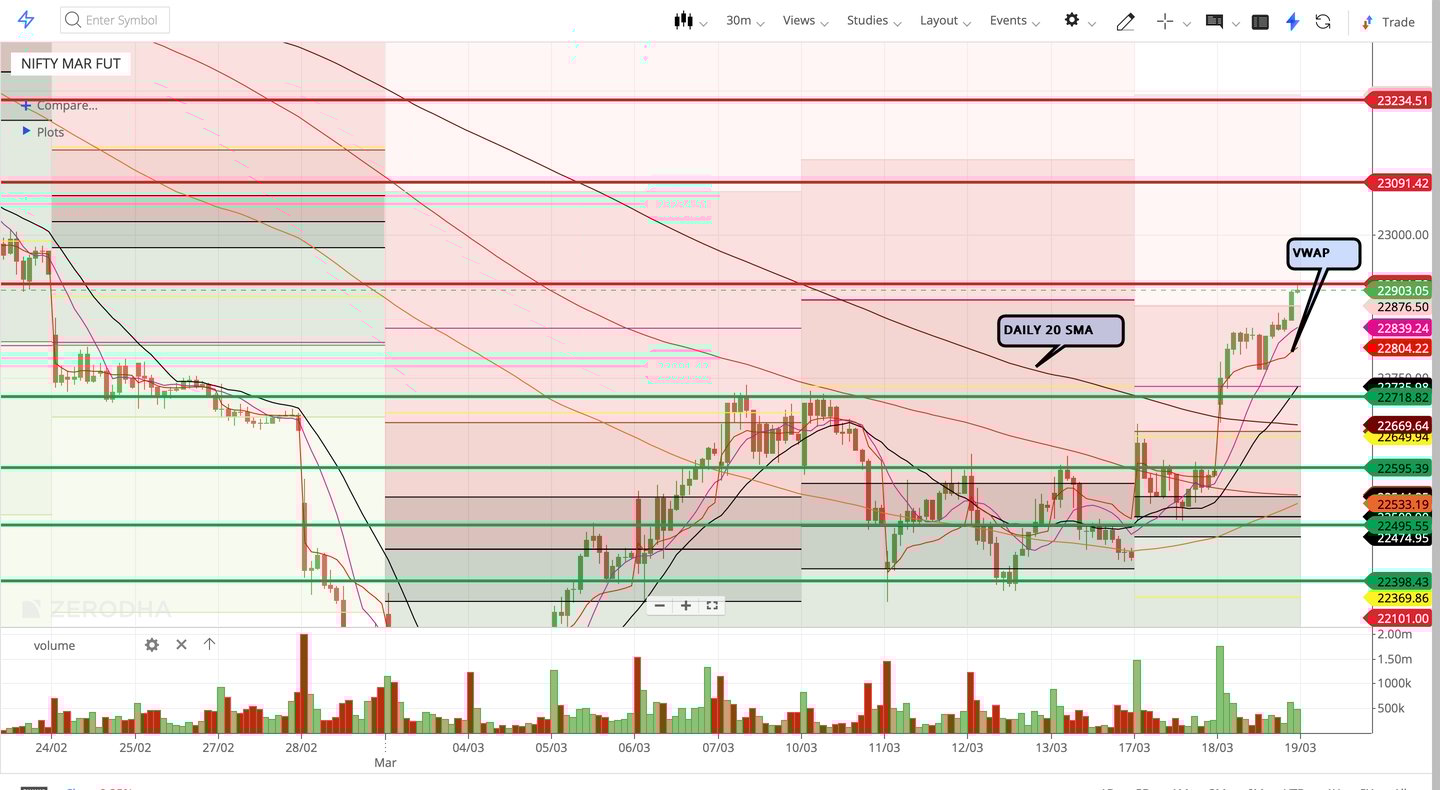
Nifty made breakout above previous day Range then taken pull back support from daily 20 SMA then made another breakout above previous week high and then taken pull back support from VWAP and Trended for the entire day...
Supports for Today Market --> 22770--22720--22600
Resistance for Today Market --> 22910--23100--23230
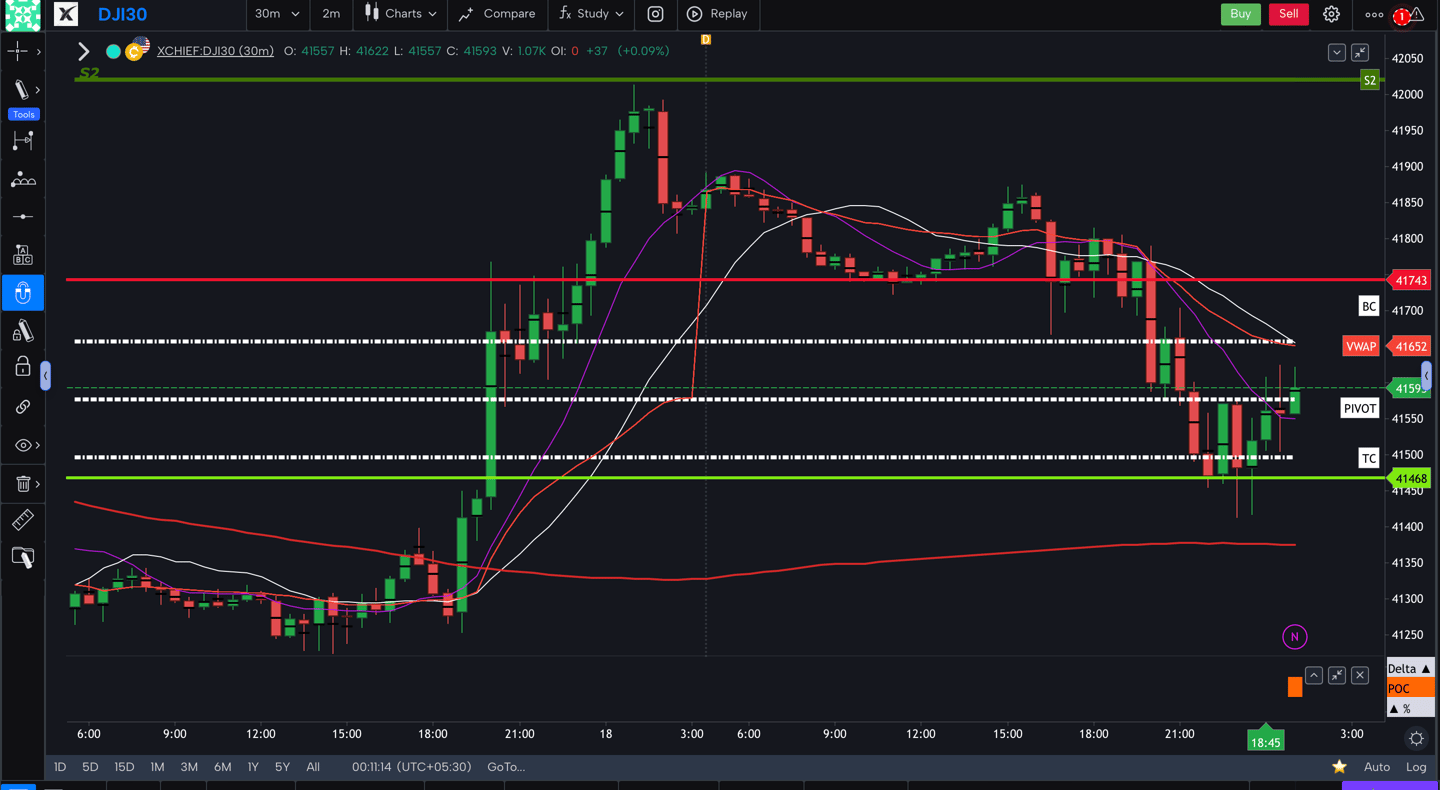
DOW JONES MARKET STRUCTURE
Dow jones got rejected from Monthly Timeframe S2 Level ( 42000 ) and got Bearish Momentum then made breakout below support levels 41750 then tested next Support at 41450 level.
Then Dow Consolidated within Previous Day Range.
Supports for Today Market --> 41450--41250
Resistance for Today Market --> 41750--42000
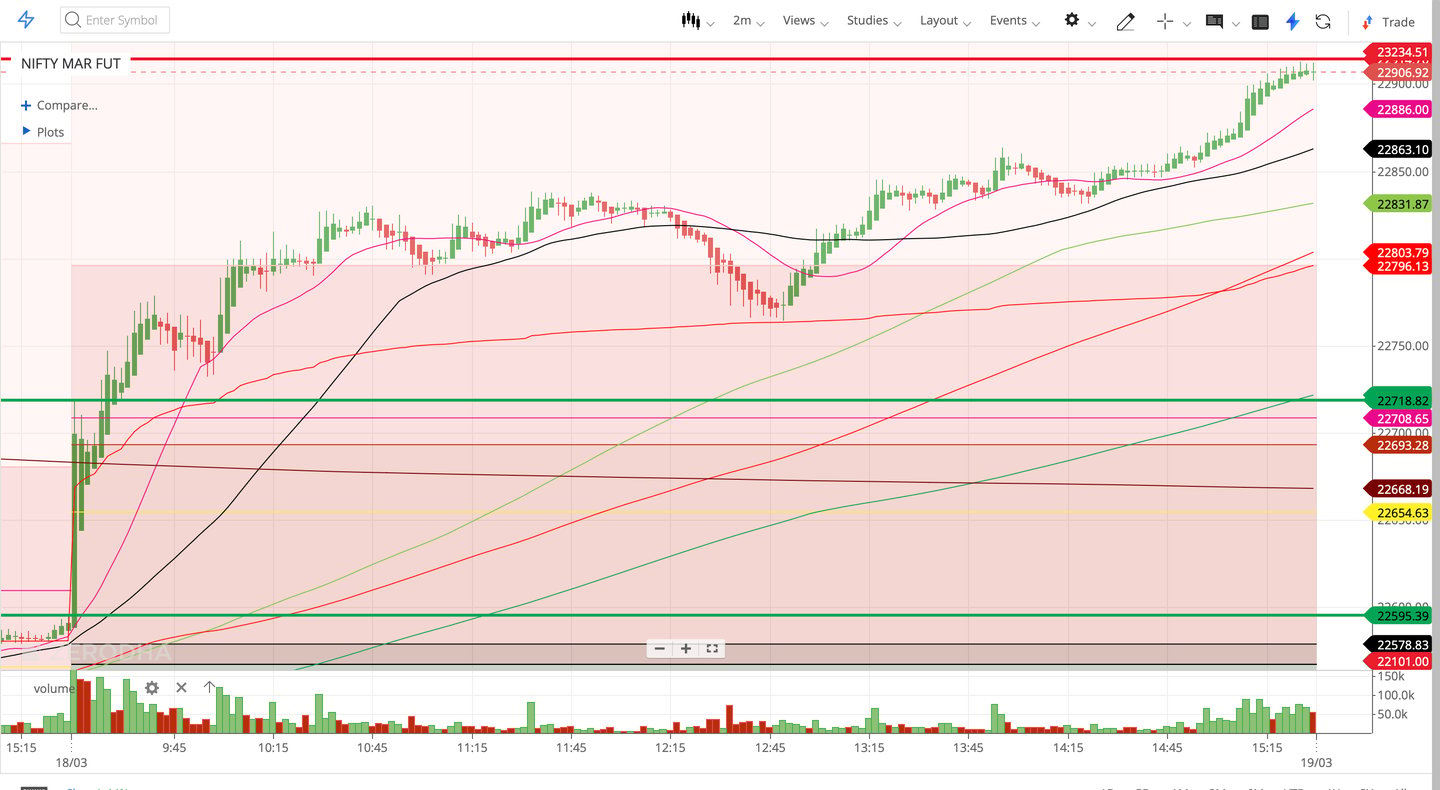
Nifty made breakout above previous day Range with bullish Momentum then taken pull back support from daily 20 SMA then made another breakout above previous week high and then taken pull back support from VWAP and Trended for the entire day...
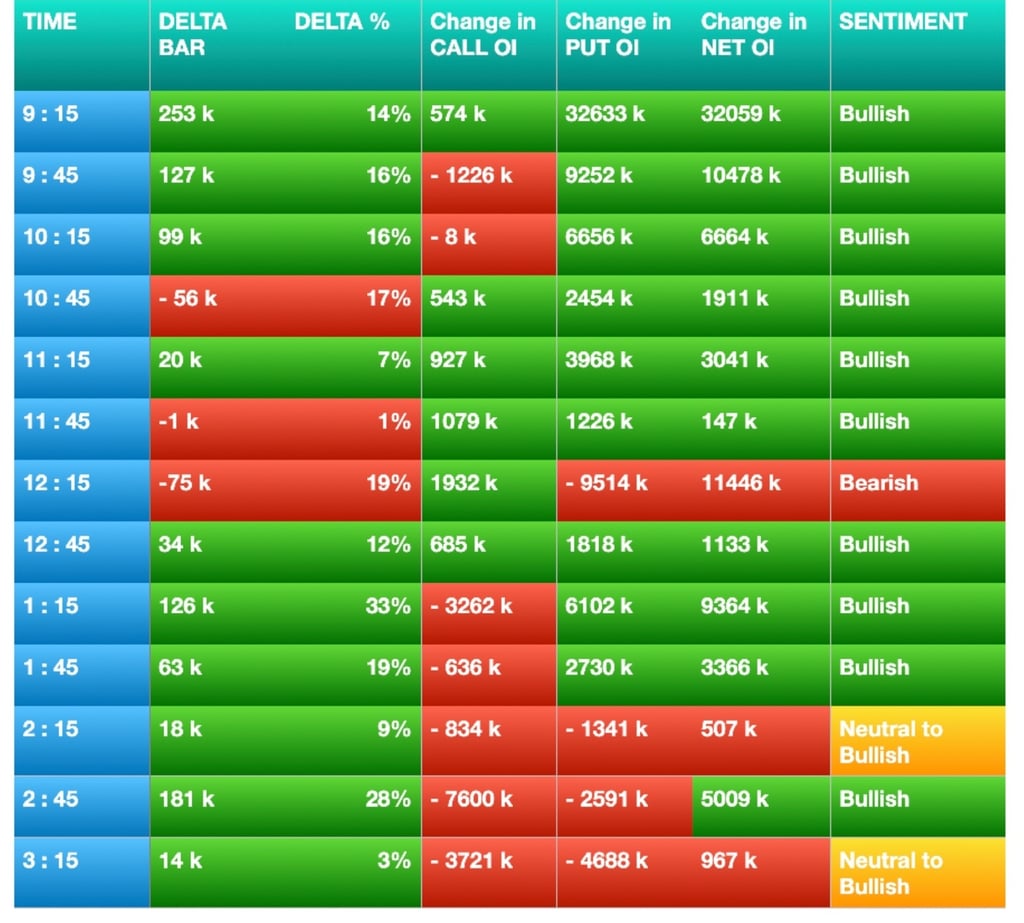

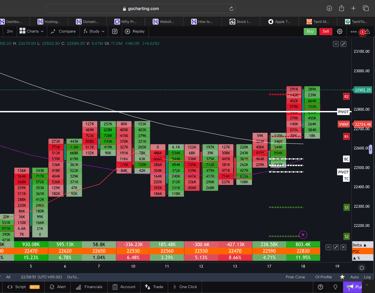
NIFTY MARKET SENTIMENT ANALYSIS BY USING DELTA BAR STATISTICS & TRENDING OI DATA ( 18-03-2025 )
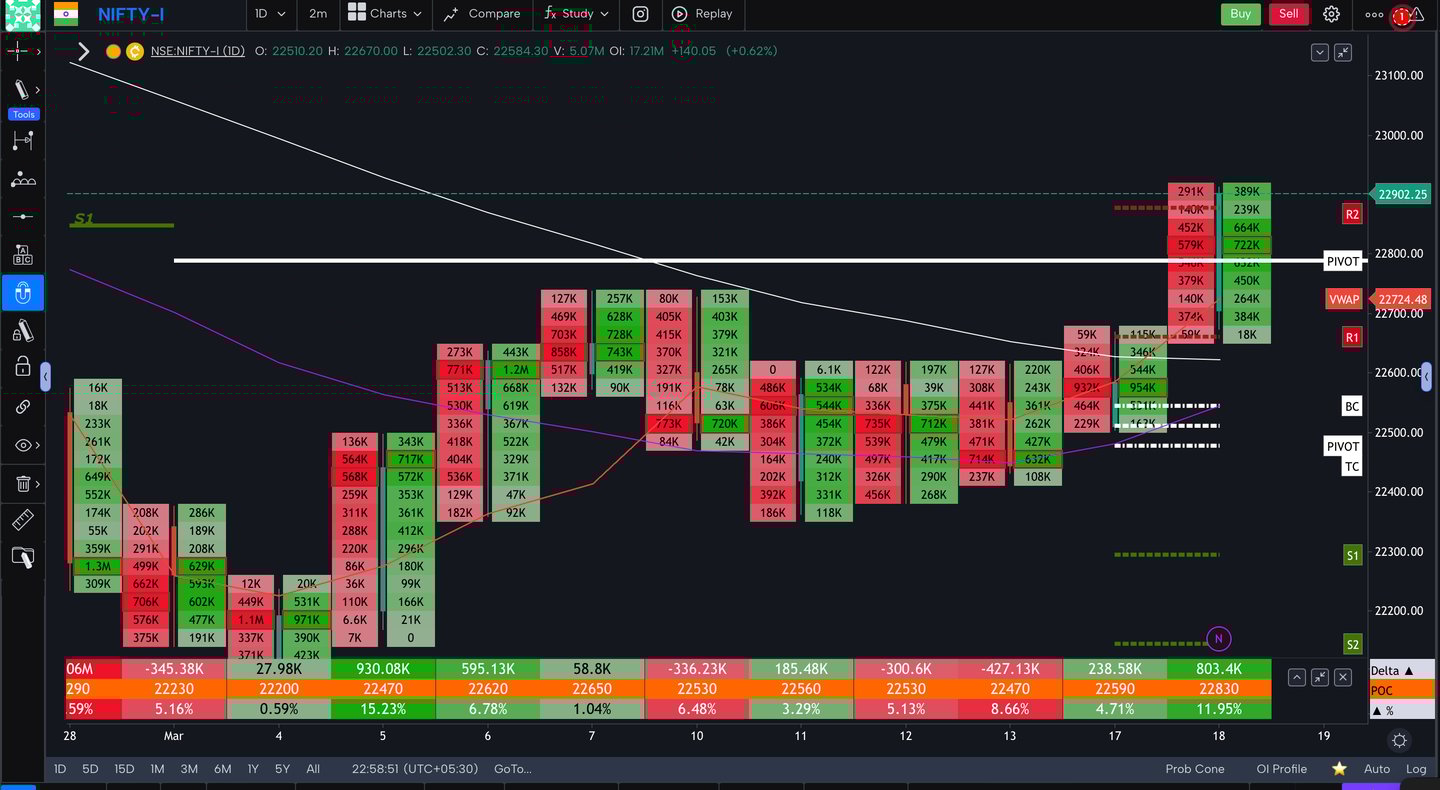
NIFTY MARKET FUTURE TRENDS PREDICTION
Nifty Daily candle looks like High close bullish Candle with bullish Bias and it tested and taken pull back support from 20 SMA in Daily Chart.
Scenario 2 - As our Mother Market Dow Jones shows Bearish Bias within Previous Day Trading Range Bears may short from 22910 level in the morning session and take bearish Momentum to test 22770 and 22600 levels on the Down side.
Scenario 1 - As the after noon session was in control of bulls they may break 22910 resistance today and trend towards 23100 and even beyond to test 23230 level.
Scenario 3 - Nifty may Trade with in a Range of 22910 level on upside to 22720 level on downside.
Daily analysis of Nifty price action trends.
Nifty price action - future trend prediction
© 2025 Nifty Price Action Invetopedia. All rights reserved.
Nifty price action investopedia
TO FOLLOW...
JOIN OUR SOCIAL MEDIA