Nifty Price Action Investopedia
Nifty and Dow Price action Market Structure (28-03-2025)
Dr.Amir
Nifty Price Action
Daily price action analysis, trends, and trade opportunities with visual examples and Trading insights.
( " Focus on Risk Not on Reward " )
Date : 28-03-2025
" Pro Traders are sitting with Draw Down of only 5 % after 10 consecutive Loss Trades But Retail Traders are sitting with only 5% capital after 10 consecutive Loss Trades "
Do you know Why ? They increase Position Size on each Consecutive Trades Just to get out of those Losses Quicker due to Over Confidence
"The Secret is You will Win in This Probability Game Over time if your Capital Loss Per Trade is Constant Through Position Sizing"
What Happened today ? (28-03-2025) ( NIFTY & DOW )
IDENTIFICATION OF MARKET TREND
NIFTY MARKET SENTIMENT ANALYSIS BY ORDER FLOW CHART USING DELTA BAR STATISTICS
VISUALISING LIKELY FUTURE TREND ( For 1-04-2025 )
AGENDA
What we Expected Today? (28-03-2025) ( PRE MARKET )
MARKET SENTIMENT ANALYSIS BY USING TRENDING OI DATA
VISUALISING LIKELY FUTURE TREND for ( 28-03-2025 )
MARKET STRUCTURE ( NIFTY & DOW )
What We Expected today ?
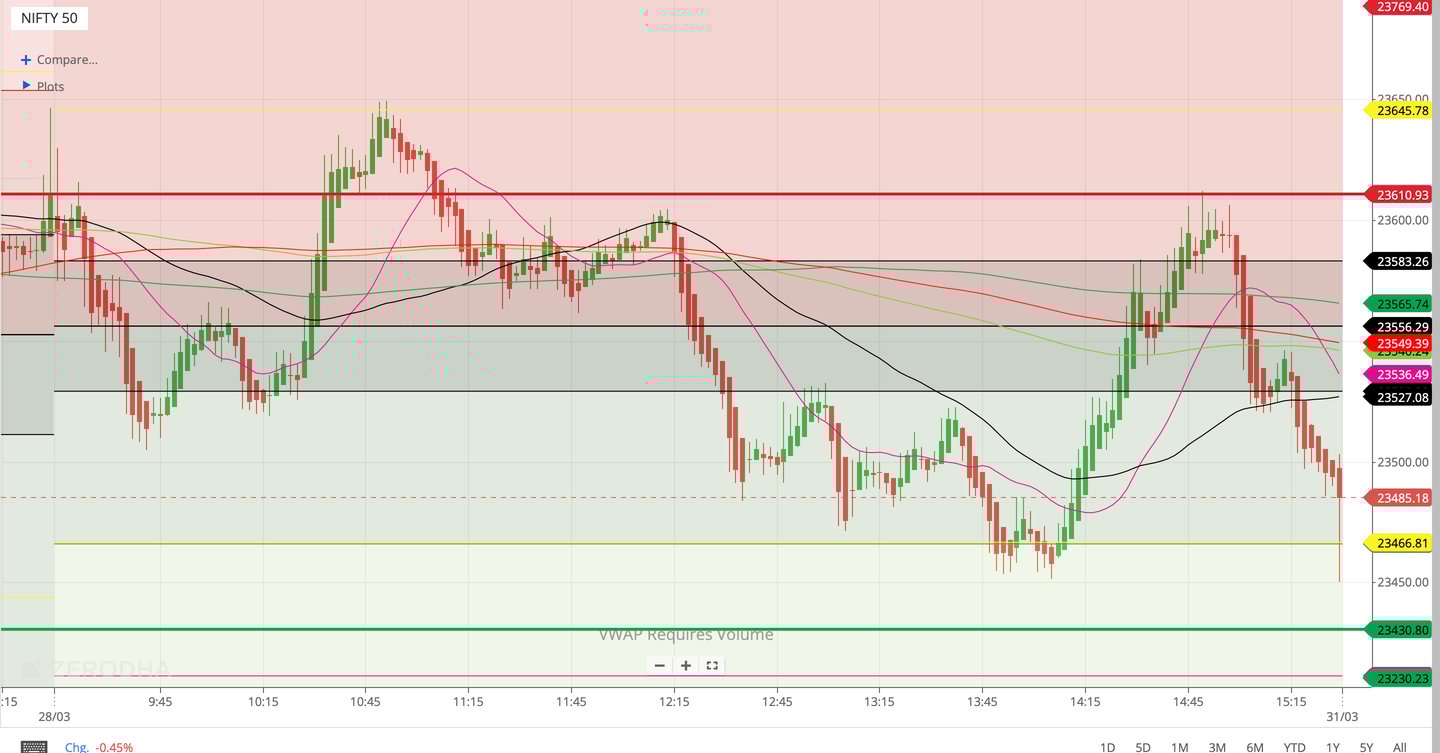
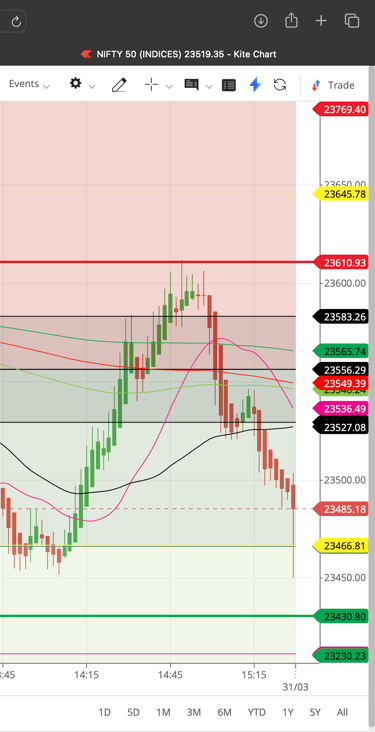
Scenario 1 - As the after noon session was in control of Bulls they may break 23610 Resistance Level and trend towards 23770 level on the Up side.
Scenario 2 - we may have Trading In a Range Day within Previous Day Trading Range between 23610 Level on Up side to 23430 Levels on the Down side.
Scenario 3 - Nifty may got Rejected from 23610 Level Then it may have Bearish Momentum to Break 23430 Level and then it may Head towards 23230 Levels on the Down side once again.
Scenario 2 - we may have Trading In a Range Day within Previous Day Trading Range between 23610 Level on Up side to 23430 Levels on the Down side in Nifty Spot.
What Happened today ?
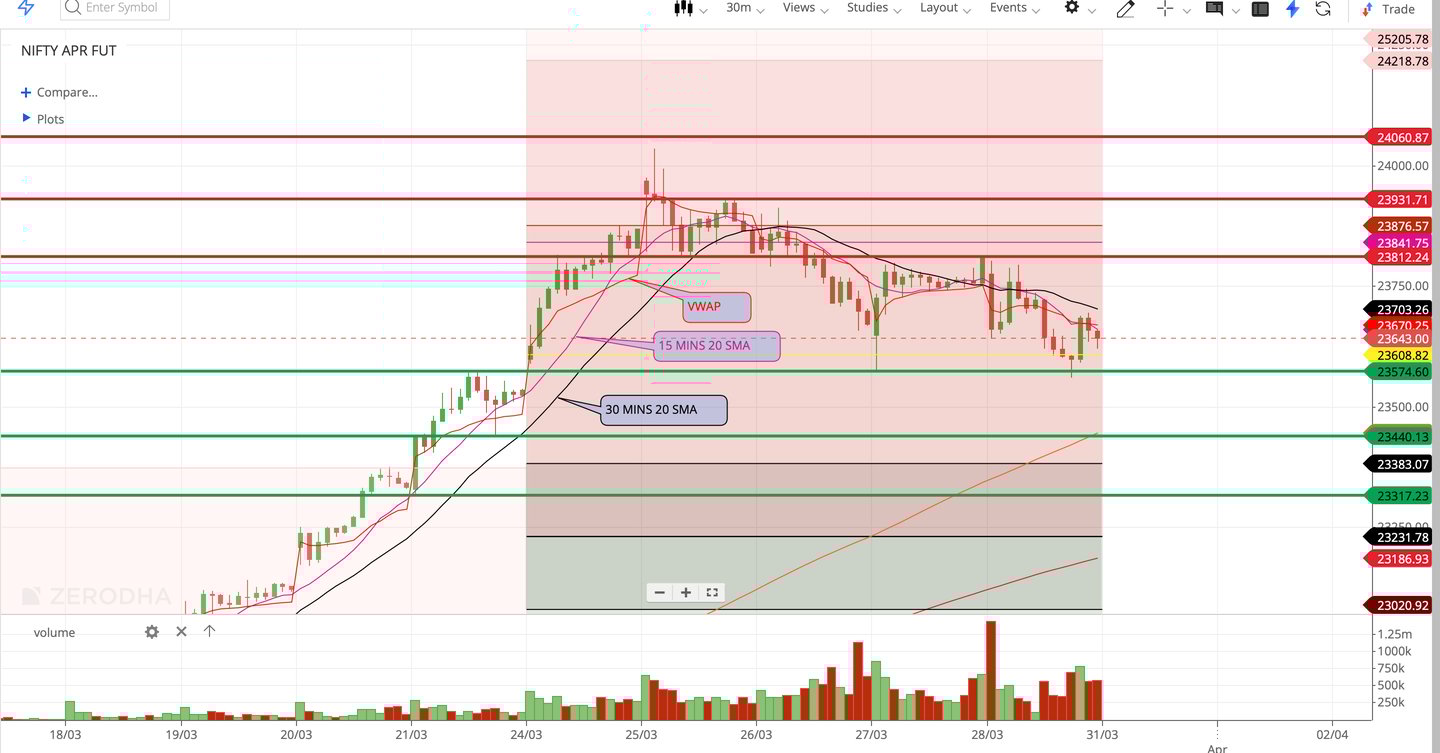
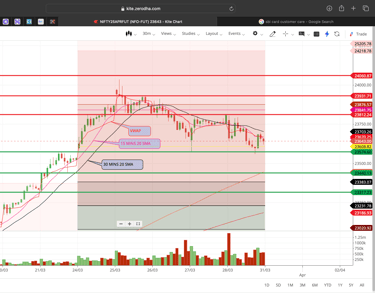
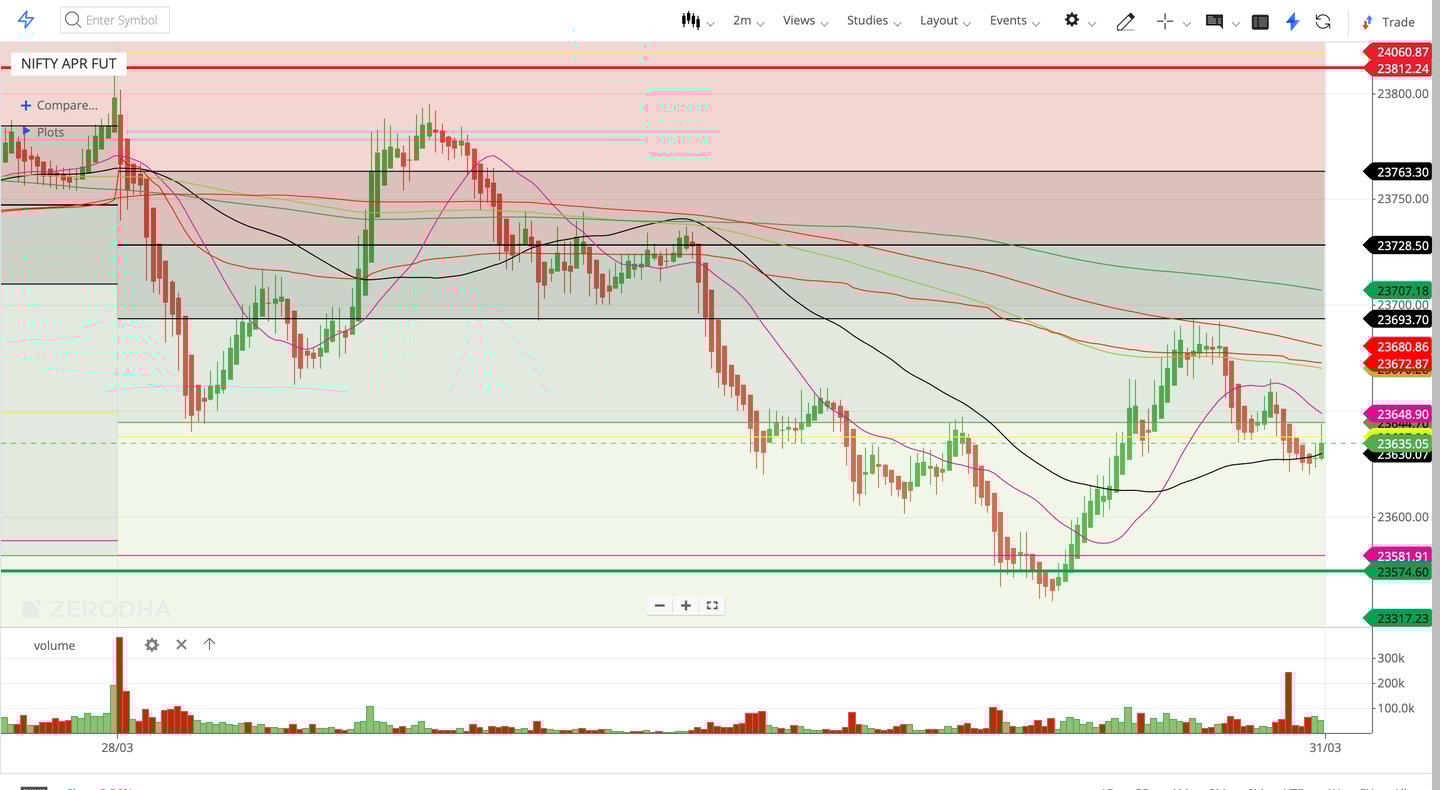
Nifty Traded within a Range of 23800 Level on the up side to 23570 Level on the Down side in Future Market. The afternoon Session was in the control of Bears and Tested 23570 level on down side but got Rejected from there then trended with Bullish Bias towards VWAP Where it got Rejected Once again and Presented us a DOUBLE DISTRIBUTION TREND DAY On the Down Side.
Supports for Today Market --> 23570 -- 23440 -- 23310
Resistance for Today Market --> 23810 -- 23930 -- 24060
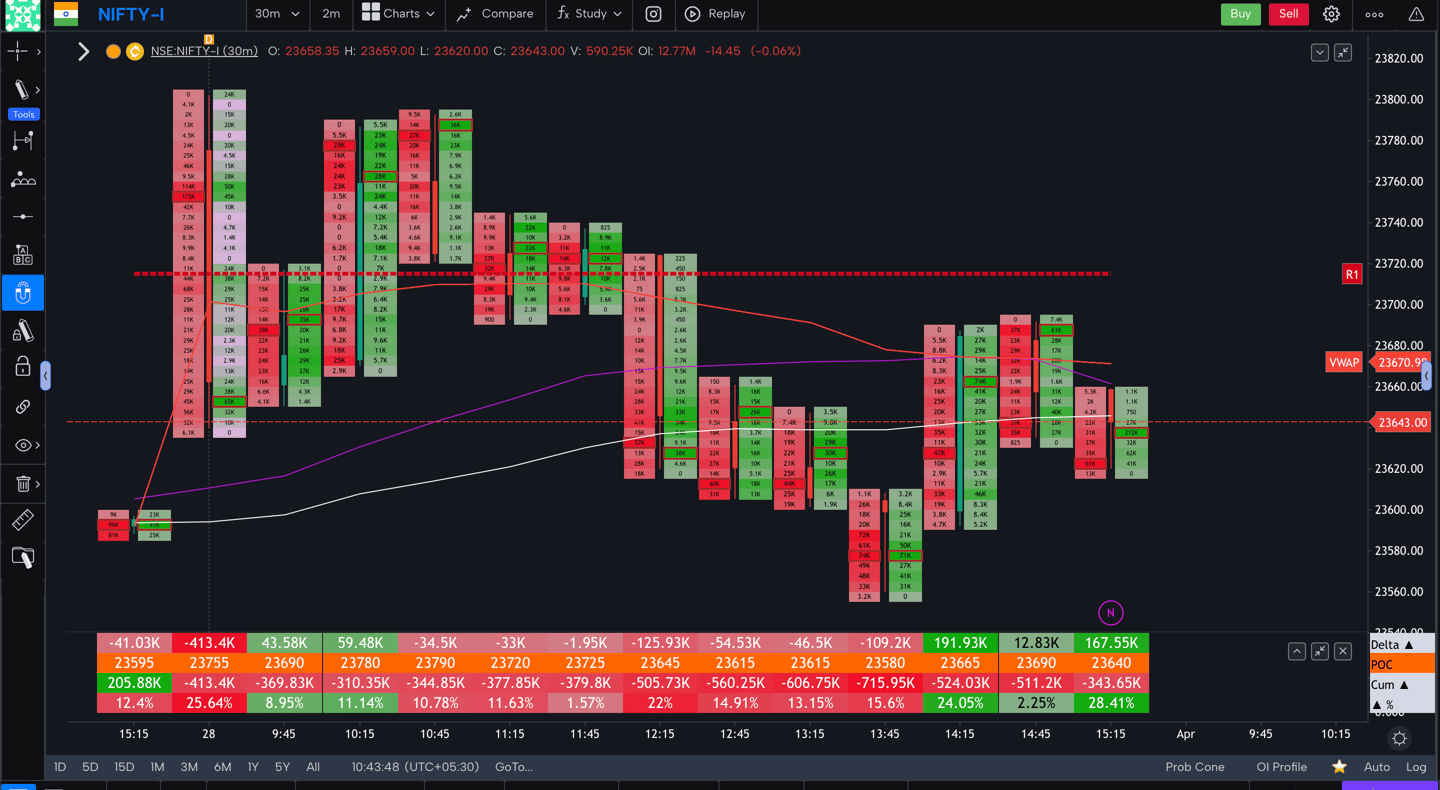
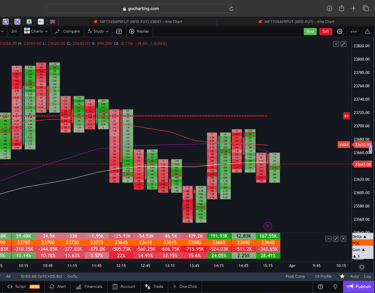
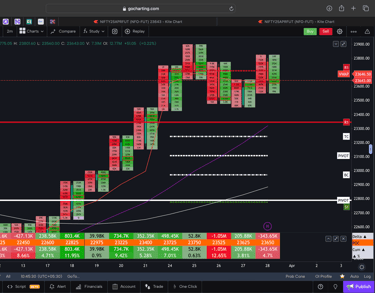
NIFTY MARKET SENTIMENT ANALYSIS BY USING ORDER FLOW CHART ( 28-03-2025 )
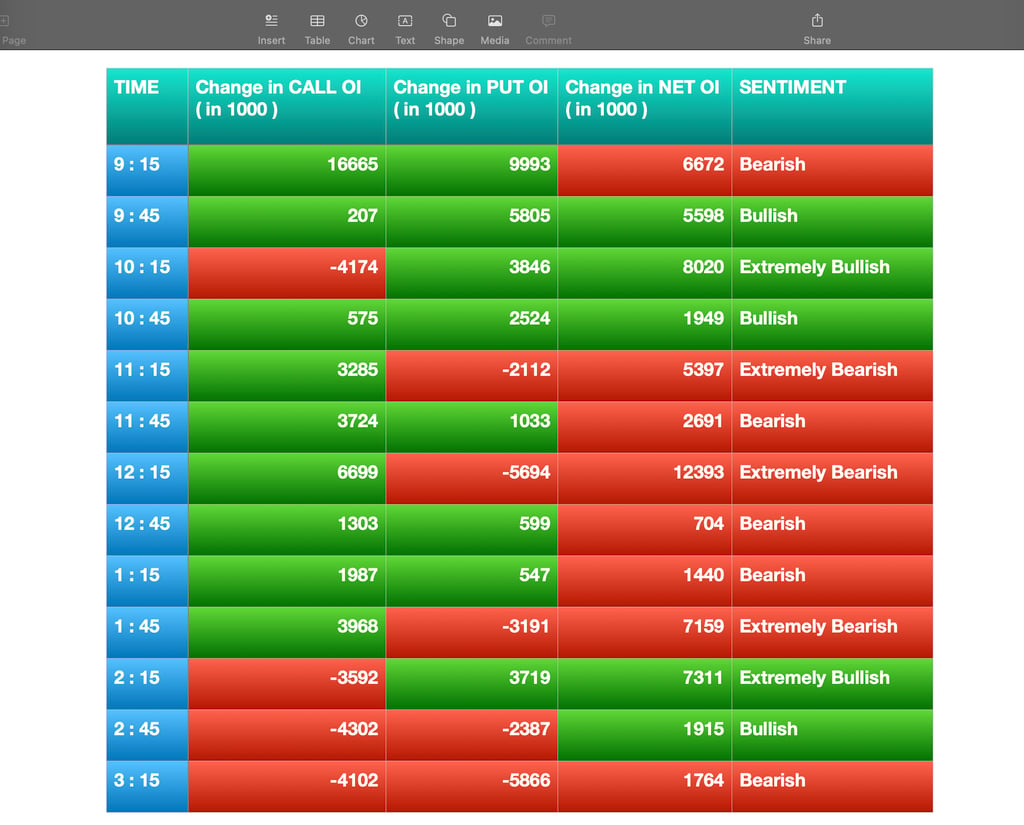

NIFTY MARKET SENTIMENT ANALYSIS BY USING TRENDING OI DATA ON ( 28-03-2025 )
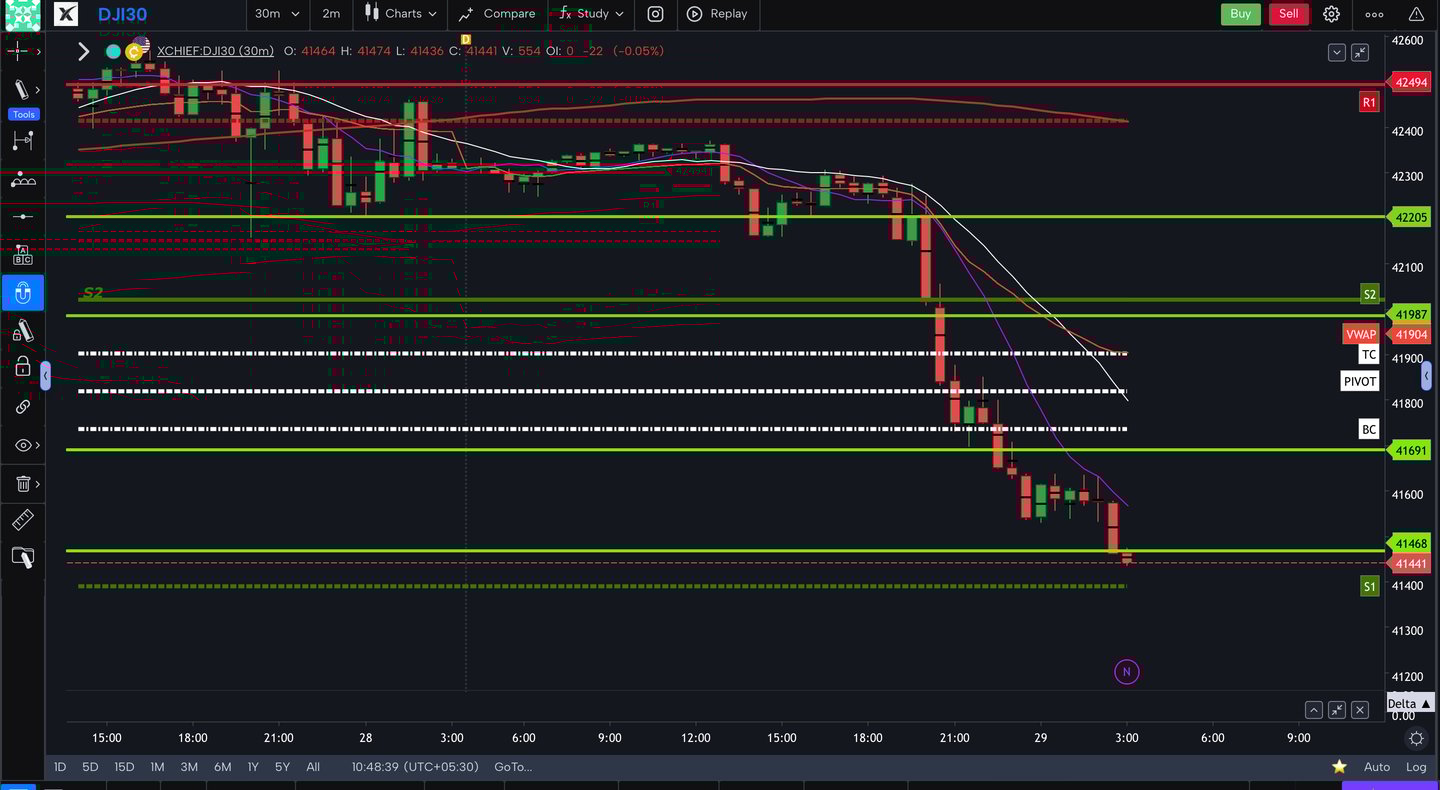
Dow Made a Range Breakout at Previous Day Range Resistance Level 42200 on Downside then with BREAKOUT pull Back to the same level it Trended with increased Bearish Momentum on the Downside and Tested 42000, 41700 and 41460 Levels One after another.
Supports for Future Market --> 41470 -- 41260 -- 41000
Resistance for Future Market --> 41700 -- 42000 -- 42200
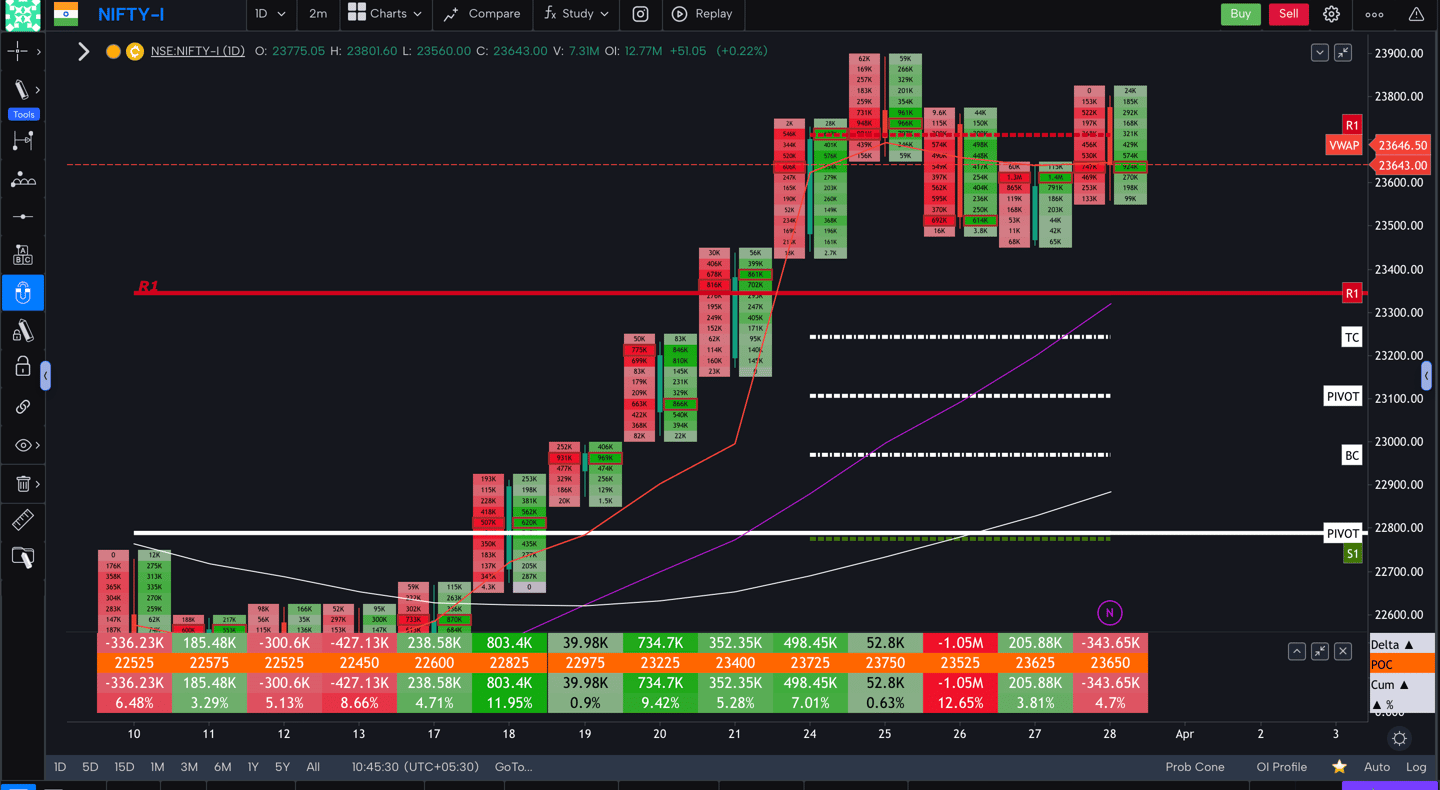
Today Nifty Daily candle looks like Low close Bearish Candle with Bearish Bias and tested 23570 Level and Presented us with a DOUBLE DISTRIBUTION TREND DAY On the Down Side.
Scenario 2 - we may have Trading In a Range Day within Previous Day Trading Range between 23810 Level on Up side to 23570 Levels on the Down side.
Scenario 1 - As the after noon session was in control of Bears they may break 23570 Support Level and trend towards 23440 and 23310 levels on the Down side.
Scenario 3 - Nifty may got Rejected from 23570 Level Then it may have Bullish Momentum to Break 23800 Level on the Up side and then it may Head towards 23930 and 24060 Levels on the Up side once again.
NIFTY MARKET FUTURE TRENDS PREDICTION ( FOR (01-04-2025)
Disclaimer
The information made available is for educational purposes only. we at Nifty Price Action Investopedia do not recommend the purchase, sale, or holding of any investment; the use of any investment selection methodology; the use of any specific financial tools or trading platforms; or the use of any specific financial planner, advisor, broker or dealer. Do remember that trading and investing always involve high levels of risk. Any money that you allocate to trading and investing may be lost completely and at any time. Any responsibility for any trading or investing activity that you might undertake is yours and yours alone. The demonstrations of trading processes including but not limited to choosing an investment and making a trade presented are not a representation or prediction that any account will or is likely to achieve profits or losses similar to those discussed. Future results can be dramatically different from the possibilities that are presented here. Past performance does not guarantee future results
Daily analysis of Nifty price action trends.
Nifty price action - future trend prediction
© 2025 Nifty Price Action Invetopedia. All rights reserved.
Nifty price action investopedia
TO FOLLOW...
JOIN OUR SOCIAL MEDIA