Nifty Price Action Investopedia
NIFTY & DOW PRICE ACTION MARKET STRUCTURE (22-05-2025)
Dr.AMIR & DR.SHAMALA
What Happened on (21-05-2025)........?( POST MARKET )
IDENTIFICATION OF MARKET TREND
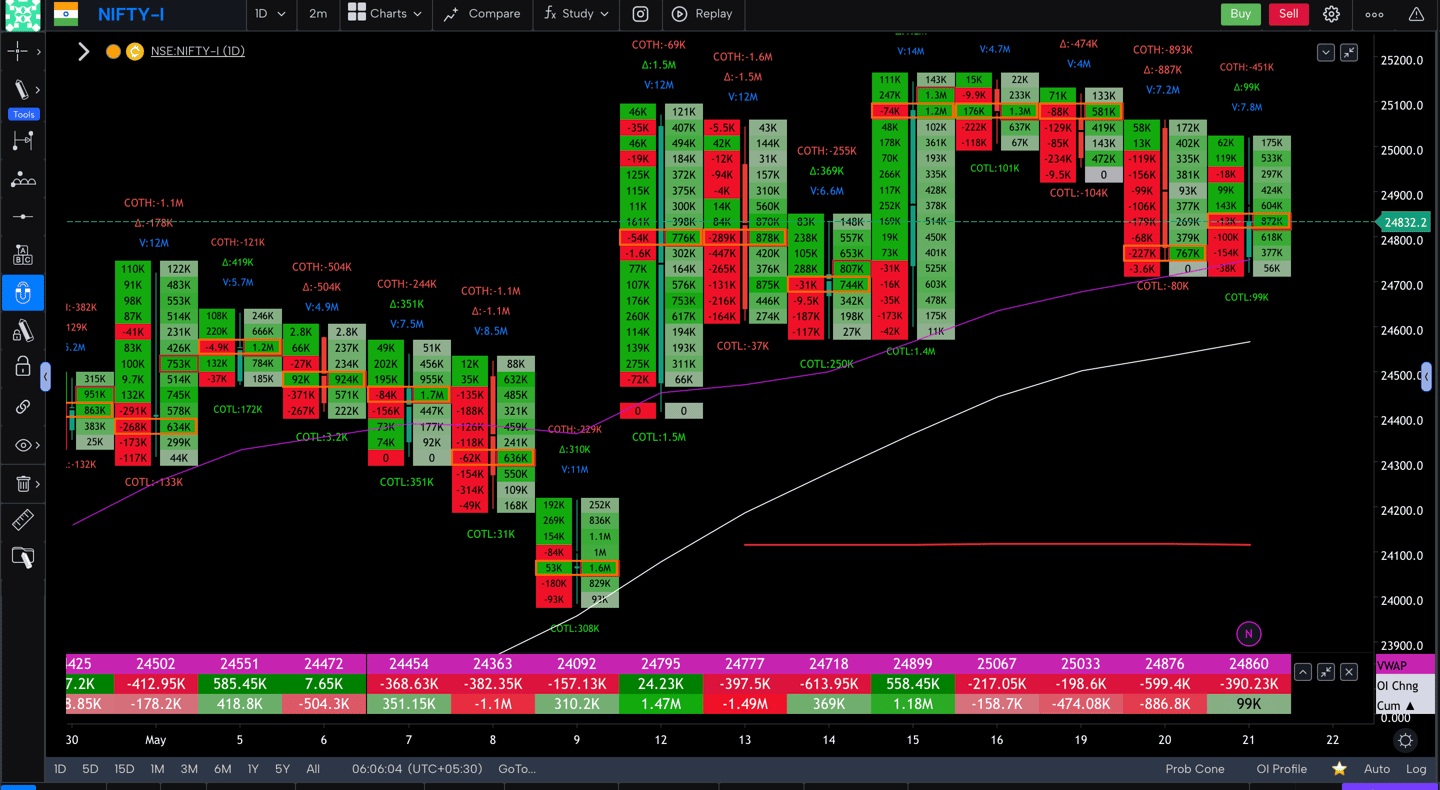
NIFTY MARKET SENTIMENT ANALYSIS BY ORDER FLOW CHART USING DELTA BAR STATISTICS
VISUALISING LIKELY FUTURE TREND FOR (22-05-2025)
AGENDA
What we Expected on (21-05-2025)....?( PRE MARKET )
MARKET SENTIMENT ANALYSIS BY USING TRENDING OI DATA
MARKET STRUCTURE ( NIFTY & DOW )
What We Expected on (21-05-2025)...?
Scenario 1 - As the after noon session was in control of Bears they may break 24770 Level and then trend towards 24630 and 24530 levels on the Down side.
Scenario 2 - we may have Trading In a Range Day within Previous Day Trading Range between 25020 Level on Up side to 24770 Level on the Down side.
Scenario 3 - Nifty may got Rejected from 24770 Level Then it may have Bullish Momentum to Break 24880 Level on the Up side and then it may Head towards 25020 and 25125 Levels on the Up side once again.
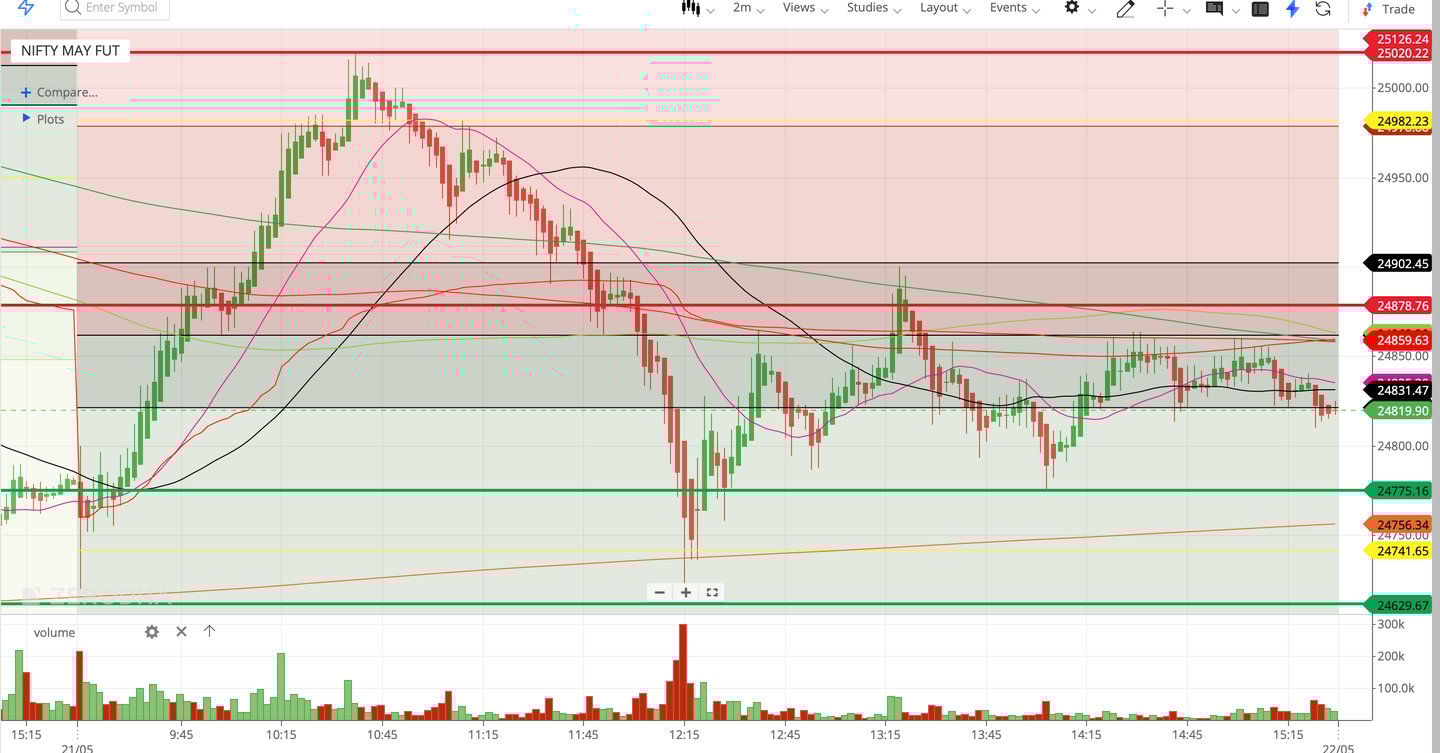
What Happened on (21-05-2025)...?
Scenario 2 - we may have Trading In a Range Day within Previous Day Trading Range between 25020 Level on Up side to 24770 Level on the Down side.
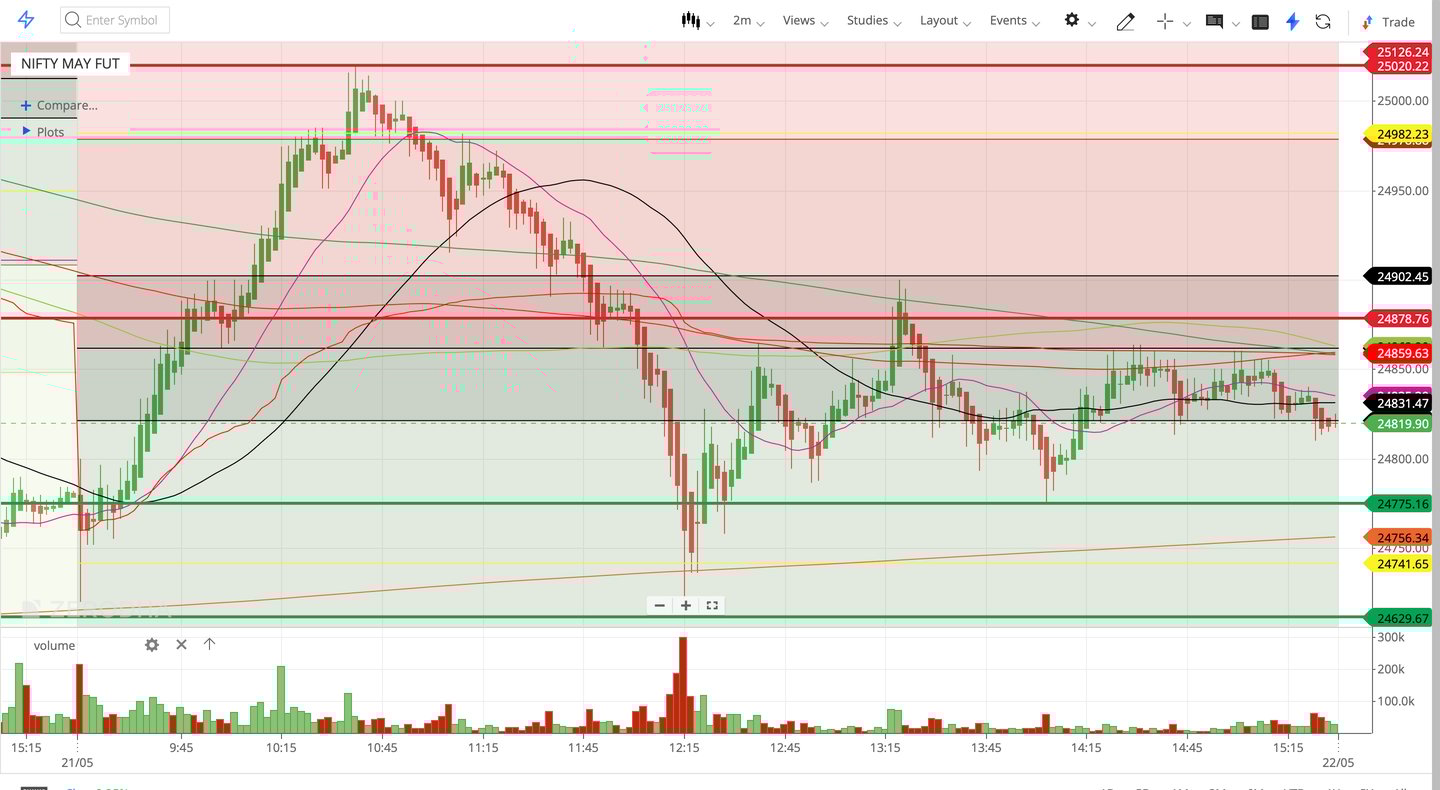
Nifty Traded within Previous Day Range (as Expected from our Pre Market Future Trend Prediction Scenario 2) between 25020 Level on the up side to 24770 Level on the Down side in Future Market. The afternoon Session was in the control of Bulls and Presented us with a TRADING IN A RANGE DAY.
Supports for Future Market --> 24770 -- 24710 -- 24630
Resistance for Future Market --> 24880 -- 25020 -- 25125
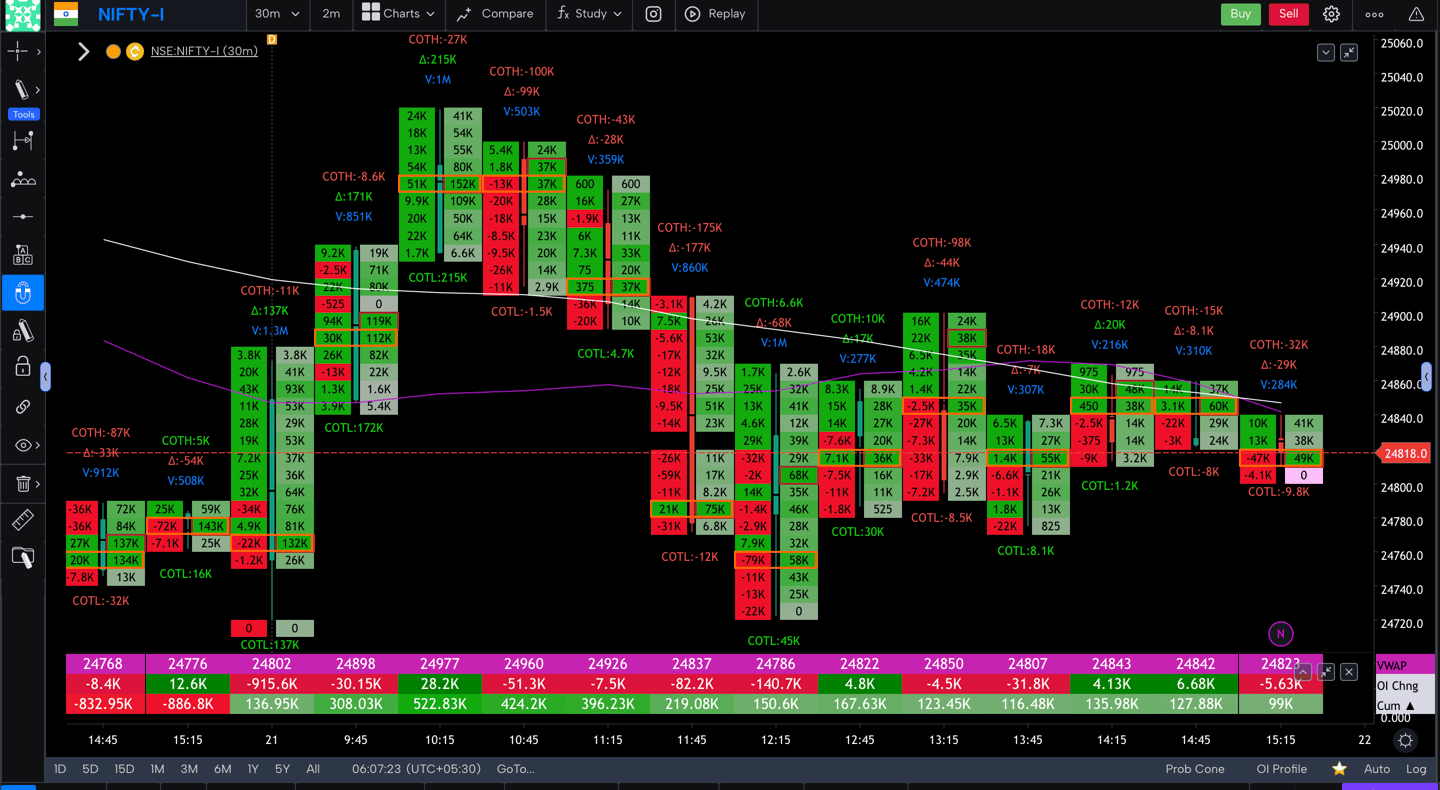
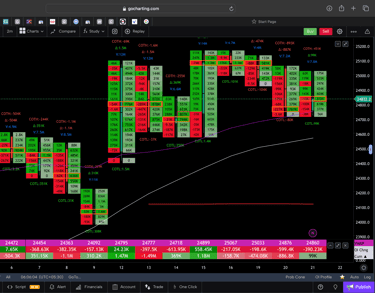
NIFTY MARKET SENTIMENT ANALYSIS BY USING ORDER FLOW CHART ( 21-05-2025 )
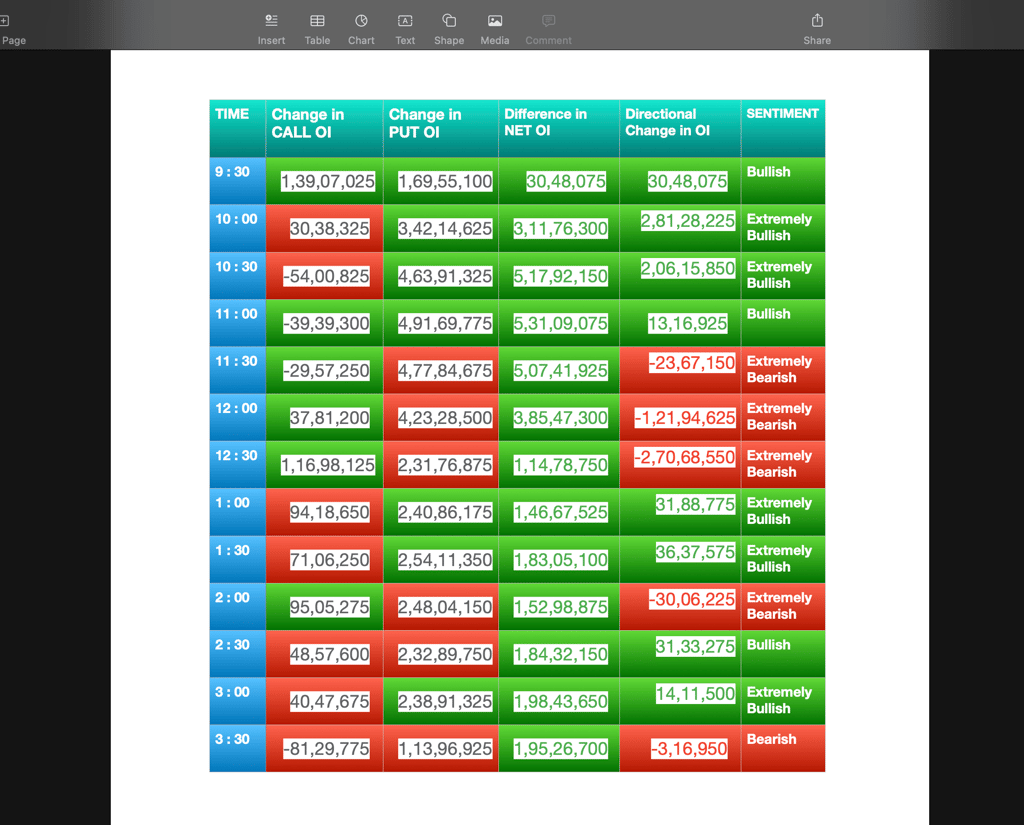
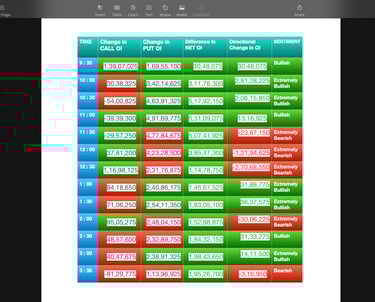
NIFTY MARKET SENTIMENT ANALYSIS BY USING TRENDING OI DATA ON ( 21-05-2025 )
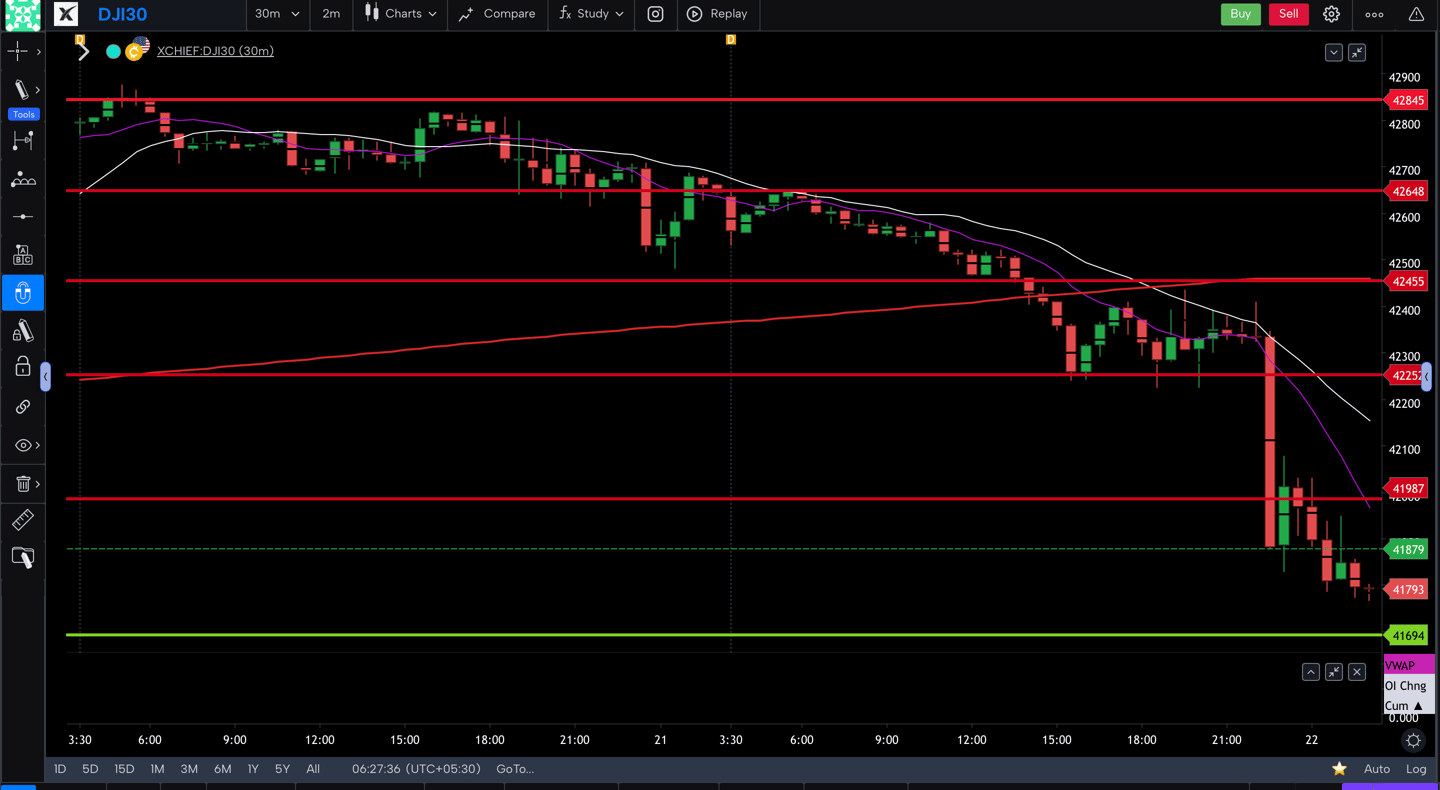
Dow got Rejected from 42650 Level and then with Bearish Momentum it Broke 42450 Level on the Down side and then it Headed towards 42000 Levels on the Down side once again.(as Expected from our Pre Market Future Trend Prediction ) and Presented us with a TREND DAY on the Down side.
Supports for Future Market --> 41700 -- 41500 -- 41250
Resistance for Future Market --> 42000 -- 42250 -- 42450
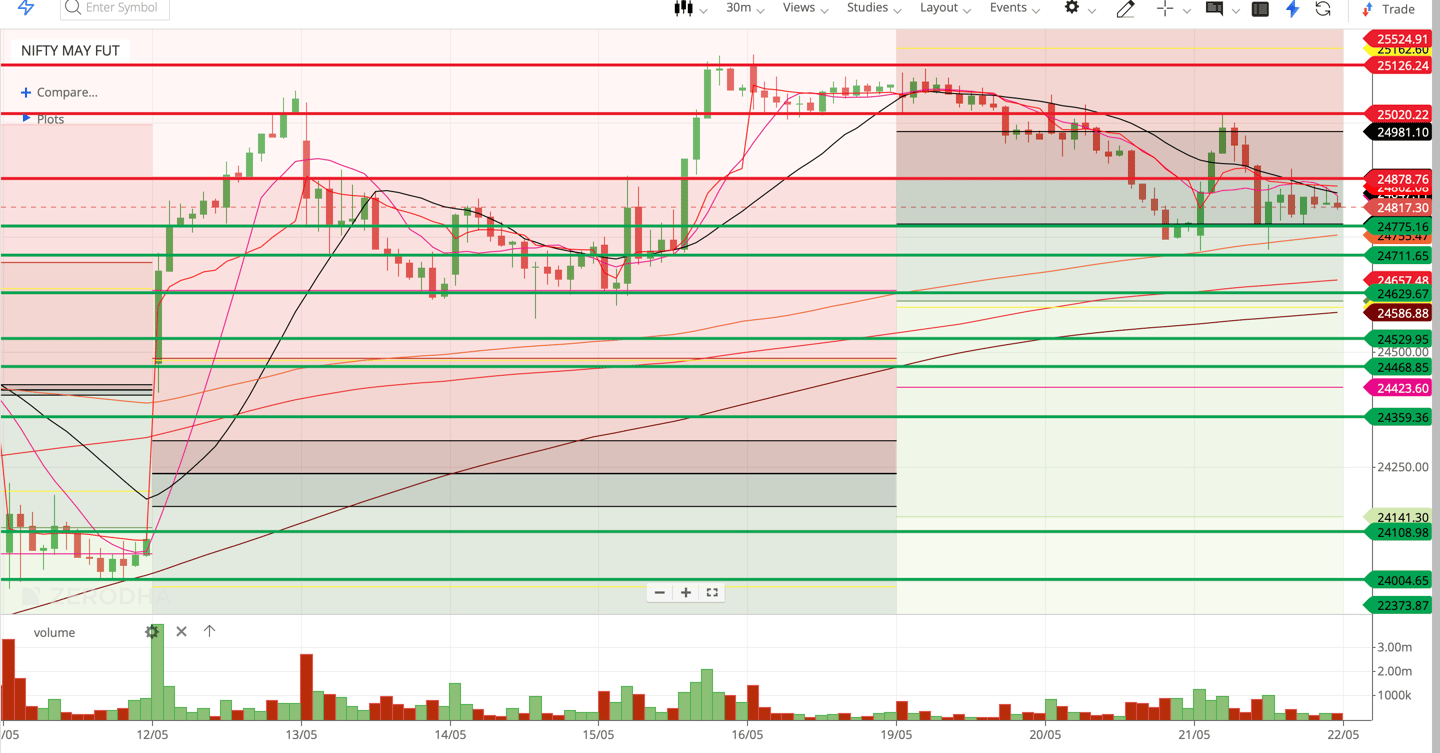
Nifty Daily candle looks like Mid close Bull Candle with Bullish Bias and tested 25020 Level on the Up side and Presented us with a TRADING IN A RANGE DAY.
Scenario 2 - we may have Trading In a Range Day within Previous Day Trading Range between 25020 Level on Up side to 24770 Level on the Down side.
Scenario 1 - As the after noon session was in control of Bulls they may break 24880 Level and then trend towards 25020 and 25125 levels on the UP side.
Scenario 3 - Nifty may got Rejected from 24880 Level Then it may have Bearish Momentum to Break 24770 Level on the Down side and then it may Head towards 24710 and 24630 Levels on the Down side once again.
NIFTY MARKET FUTURE TRENDS PREDICTION FOR (22-05-2025)
Disclaimer
The information made available is for educational purposes only. we at Nifty Price Action Investopedia do not recommend the purchase, sale, or holding of any investment; the use of any investment selection methodology; the use of any specific financial tools or trading platforms; or the use of any specific financial planner, advisor, broker or dealer. Do remember that trading and investing always involve high levels of risk. Any money that you allocate to trading and investing may be lost completely and at any time. Any responsibility for any trading or investing activity that you might undertake is yours and yours alone. The demonstrations of trading processes including but not limited to choosing an investment and making a trade presented are not a representation or prediction that any account will or is likely to achieve profits or losses similar to those discussed. Future results can be dramatically different from the possibilities that are presented here. Past performance does not guarantee future results
Daily analysis of Nifty price action trends.
Nifty price action - future trend prediction
© 2025 Nifty Price Action Invetopedia. All rights reserved.
Nifty price action investopedia
TO FOLLOW...
JOIN OUR SOCIAL MEDIA